
When you’ve run through enough iterations of burn down charts, you may start to see some repeating patterns. Below are three examples that we’ve seen most often, and what they might mean for your organization.
The Wandering Dog
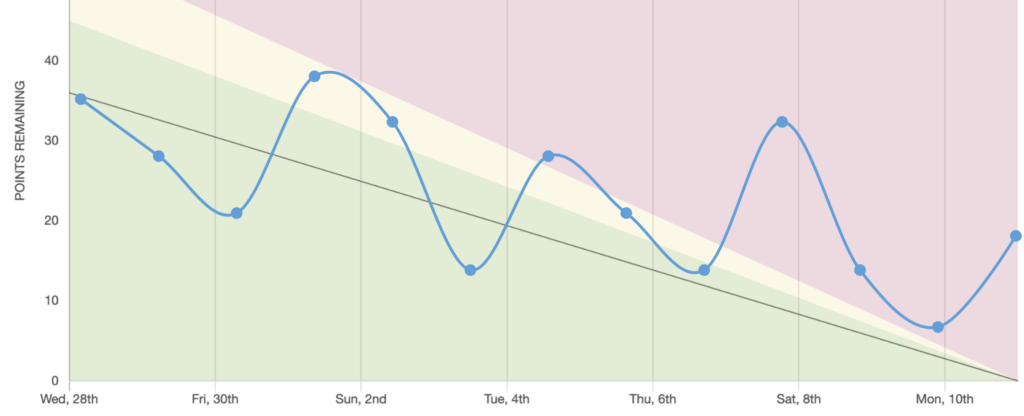
The Wandering Dog is a burn down chart that continually fluctuates. You try to keep it on track, and sometimes it does – quickly – while other times it goes in the wrong direction.
Seeing a Wandering Dog is a terrific indication of scope creep. Scope creep occurs when tasks are frequently injected into your sprint, which is generally a no-no except under emergency circumstances. Scope creep with in a sprint means that you’ll never be able to accurately predict time to completion for your sprint tasks, and indicates that your team constantly has to context switch.
Here’s a great article on how to deal with scope creep, though we might also mention 2 of our more obvious go-tos:
- Have your back log publicly visible, and force a break-in / take-out rule. That way stakeholders can see the results of their break-in.
- Shorter sprints. If everything has to be done “right now”, consider a one week sprint over a two week one.
The Optimist Burn Down Chart
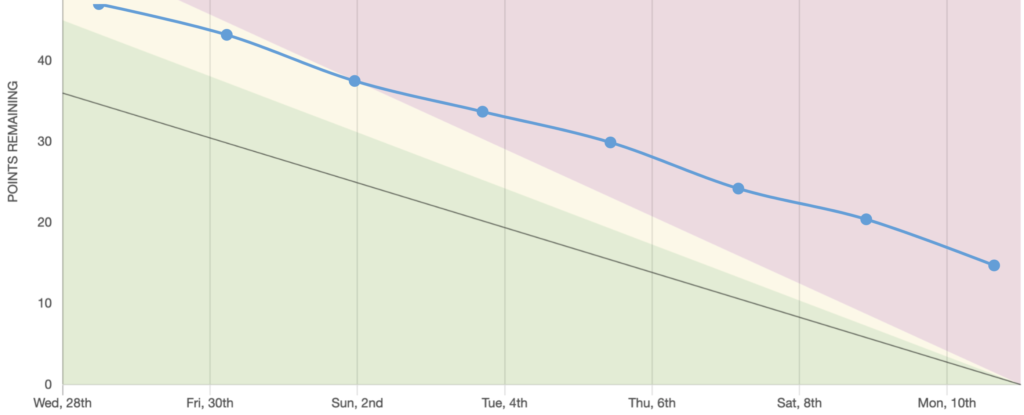
If it’s one thing we’ve learned over the years, it’s that developers usually have a pretty high opinion of themselves. (We’re developers too, don’t hate.) In fact, it’s unclear if a burn down chart has ever ended in 0 points remaining; we’ve heard rumors but nothing confirmed.
While some points remaining isn’t the end of the world, consistently and grossly over-promising and under-delivering can:
- Hinder your (and your boss’s) ability to predict your teams output.
- Reflect poorly on your team, even if they’re extremely high performing.
To stop over-committing, remind your team during sprint planning that they’re making a promise, and that – on average – they should keep it. Remind them that accuracy is more important that pace or rate, since everyone works on different tasks from week to week.
Scrumfast.com also has a handy average pace tool on the sprint planning page (see below). Here, the icon will become red when the team member appears over committed. You can change the indicator to be based on either the individual average or the team average, the latter if you don’t want to call out particular member’s relative rates.

The Sasquatch Stairs
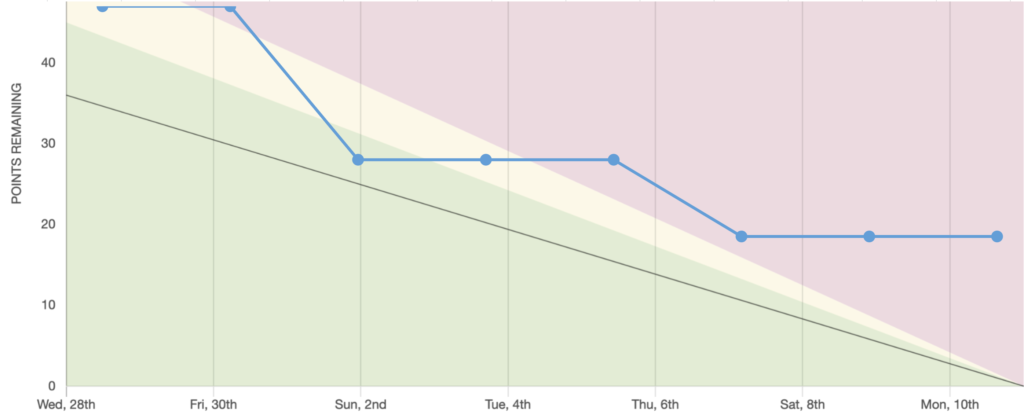
Sasquatch Stairs are, well, very large stairs for very large feet. This pattern on your burn down chart is indicative of several stories with very large points.
It’s very possible there’s nothing to worry about with this pattern. However, if you find that the bottom stair is consistently high, you should consider breaking down your stories into smaller chunks. That way, you can at least complete more iterative tasks – especially near the end of the sprint – rather than under-delivering on larger efforts.
One trick we also like to use is to tackle the large-pointed tasks first. That allows you to fit in smaller, iterative tasks by the sprint’s end.
If you notice these patterns in your own work, we hope this article will help consider what they mean, if they’re problematic, and if so, how to tackle them!